Using Infographics to Show the Value of Your Training
Rob Berry, winner of the 2014 ATD-VOS Don Kirkpatrick Scholarship, creates infographics as a visually compelling way to show what his training programs and related evaluation efforts have done for his company and its initiatives.
Here is how infographics can help you answer a critical, frequently asked question.
Using the training I received as part of the Kirkpatrick Four Levels® Evaluation Certification Program – Bronze Level, I’ve been able to structure more successful training initiatives and evaluate them in ways that make clear their true business value.
I’ve now started creating infographics as part of my evaluation for each training program my team creates. They give an overview of both learning and business metrics, and I share them with my team and our project stakeholders to show the effectiveness of each program. I use the leading indicators identified during the learning intake/needs analysis to show how a high adoption of training moves the needle on the desired business metrics.
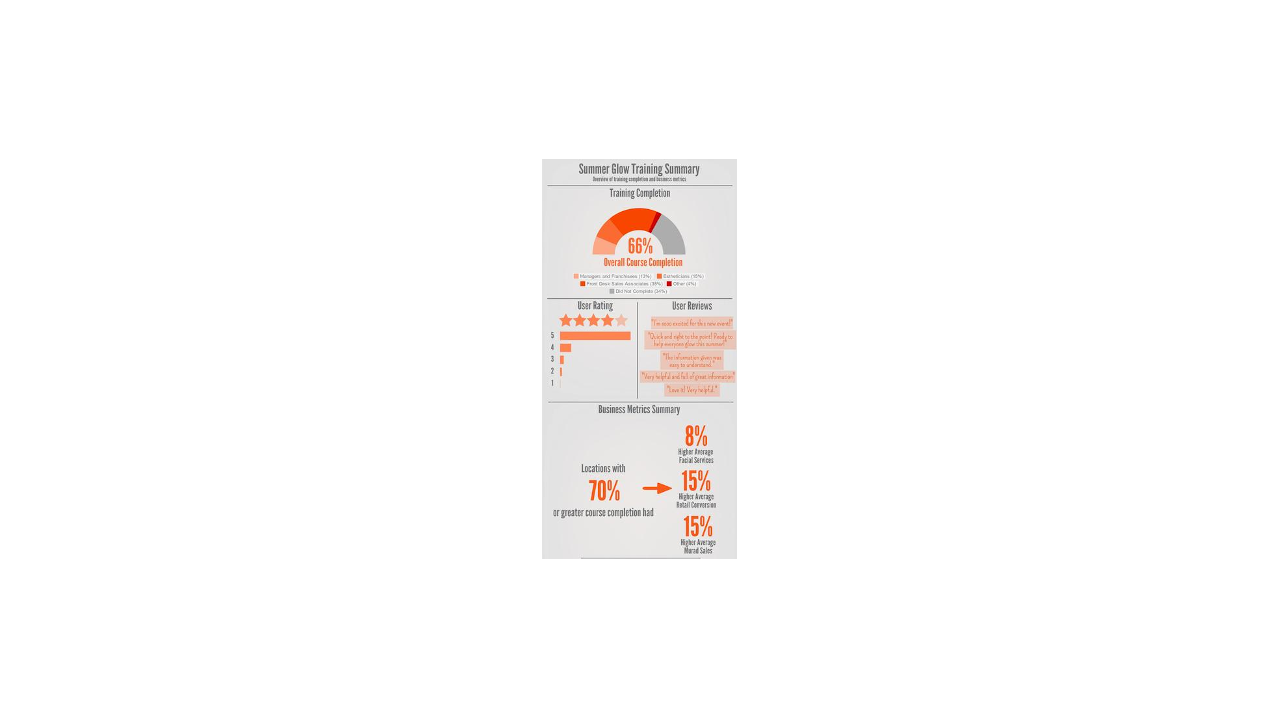
The story I’m trying to tell is not that completion of the training program is directly responsible for high business metrics – as you know, that’s a very difficult relationship to prove. Instead, I’m trying to show that locations with high adoption of our training consistently outperform those with low adoption. Seems like a no-brainer, but the graphic helps answer the critical question I get asked all the time: We know training helps, but how much does it help? Here’s an example of an infographic I created for one of our recent Massage Envy marketing promotions, the Summer Glow Skincare Event. The goal of this event was to encourage customers to purchase facials and facial products during the summer months, when exposure to harmful UV rays makes it critical to protect skin against damage. The training was geared toward a range of employees, from managers, to front desk sales associates, to estheticians.
Among other information, the infographic shows trainee opinions of the program, and comparisons of sales of facial services and products between locations with varying degrees of course completion. So far, the infographic has been very well received and has helped show our business partners the value of what we do as an L&D team.
About the Author
Rob Berry is a training professional at Massage Envy.
Don’t Miss a Feature
Sign up to receive free resources now and additional free content in our e-newsletter.
Additional Resources
Kirkpatrick Four Levels® Evaluation Certification Program – Bronze Level